
A derivative is a financial contract that derives its value from an underlying asset, essentially breaking down trades on asset valuation into specific contracts. Crypto Derivatives allow traders to express nuanced views on future valuations, however, derivatives themselves can be very complex and include many moving parts, so let’s break them down into their interconnected components.
A Deep Dive into Perps, Funding Rate, and Open Interest:
Let’s take a look into the perpetual futures product widely used in the crypto ecosystem, covering briefly what they are, how they can be used, and the definition of some key associated terms. Then we’ll focus specifically on the funding rates and open interest on Bitcoin contracts – how they’ve interacted in historical markets, what insights we can glean from them, and how trades can be structured just around them.
Crypto “perps”: What are they?
The perpetual futures or “perps” (terminology used interchangeably with perpetual swap, in this context) product is a form of derivative whose popularity in the crypto trading world is particularly evident in daily trading volume where we often see volume in the perps be many multiples of spot and options trading volume. While their invention predated the crypto markets, the crypto space is the only widely traded market with widespread adoption of this style of derivatives, explaining the synonymous nature of the two.
Simply put, the contracts are designed to leverage collateral and provide a highly liquid instrument that closely tracks spot trading price into perpetuity while offering both long and short exposure to an underlying asset. These properties make it a very attractive way to speculate on asset prices and / or hedge “physical” spot holdings. For the sake of simplicity moving forward, we’ll focus on the USD (or stablecoin) margin contracts, as opposed to, say, the original breakthrough Bitcoin-margined product offered by BitMEX.
The working parts and terminology
Let’s introduce the key mechanism that keeps the trading price of the perp contract to spot price – funding rate. This rate provides regular payments between buyers (longers) and sellers (shorters) by incentivising a market balance or peg to the spot price of the underlying asset. When the perp is trading higher than spot (i.e., perp is trading at a premium), buyers pay a percentage of their open position to sellers. This encourages traders to take up short positions (to receive the payment), thus pushing perp trading price closer to spot. And of course, the reverse is true when perp is trading lower than spot (called trading at a discount). This doesn’t always keep perp and spot at parity, but let’s cover that later.
To introduce some other terms you might hear when discussing these products, let’s cover an example scenario and pretend the rest of the market does nothing for ease of example.
Let’s say Trader A and Trader B each with $1000 margin on their accounts have no open positions. They are both trading the USDT margined BTC perp that offers up to 100x leverage perfectly tracking spot price at $10,000 per BTC.
Trader A offers to buy $10,000 worth of contracts while Trader B takes up that offer and enters on the short side of those contracts. This increases open interest (OI) of the product as there are now more unsettled contracts or open positions.
Price of BTC suddenly (before any funding occurs) increases 10% to $11,000. Note that both traders entered at 10x leverage and assume that simultaneously…
Trader B is liquidated by the exchange and forced to buy contracts (to settle their short position from before). This buy order is placed in the exchange order book. (Note that in reality this would happen earlier than a 10% increase, after fees and the required maintenance margin to reduce risk of bad debt, but we’ll gloss over those details for now).
Trader A decides to close their position, taking an equivalently sized position of the sell side of those forced buy orders from Trader B.
When all is said and done,
- Trader A has profited $1000, doubling their initial position.
- Trader B has lost all of their original posted margin.
- OI has now reduced back to where it was at the start of the example. (Again, we’re forgetting fees charged by the exchange, slippage based on the order book, and the like. These are all important factors to consider in live trading of course).
The takeaways are
- A 10x leveraged position amplifies the profits/losses by a factor of 10x, showcasing both the allure and risks of leverage.
- Open Interest is the sum total of all outstanding/unsettled/open positions.
To state the facts, let’s identify some key concepts before moving forward.
Long (short) positions: a holding that allows a trader to profit from price appreciation (depreciation) of an asset.
Leverage: the ability to enter a larger position than one’s capital would normally be able to afford (e.g. offering $1,000 of margin to enter a $10,000 position would be called a 10x leveraged position).
Spot holdings: “physical” holdings of some asset (e.g. buying BTC on an exchange which is then withdrawn to a personal wallet).
Perp: a derivative offering short/long exposure to an underlying asset that is designed to track spot price. In the crypto space, also the preferred source of leverage since its inception in 2015.
Funding rate: the underlying mechanism of the perp that incentivises trading at spot price; a fee buyers and sellers of the perp contracts pay one another.
Open Interest (OI): the total value of or number of contracts open or unsettled on a specific product.
Liquidation: the forced closing of a position by the exchange.
The Interaction Between Price Action, Funding Rate, Oi and Market Behaviour
Let’s address some ways one could factor these metrics of the perpetual futures into their trading strategies. What do they tell us about market behaviour and how can whole trades be structured around them?
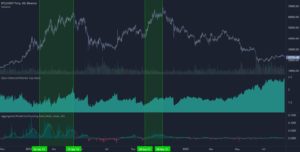
Figure 1.0: The chart above shows BTCUSDT Perp, Open Interest / Market Cap Ratio, and Aggregated Predicted Funding Rate from November 2020 to August 2022. Note the highlighted sections referring to classic bull market conditions.
Consider the chart above from Coinalyze looking at the BTC perps on Binance. Included in the chart is price, OI-in-dollar-terms to market cap ratio, and aggregated funding rate. First, note that if we assume Bitcoin inflation to be zero and OI to be constant, then price action and open interest market cap ratio are inversely related.
Let’s explore some historical market conditions on specific periods of time to see what insights into the market these charts reveal. Keep in mind that we’re considering OI as a proxy for demand for the perp product and funding rates as a proxy for where the demand is positioned (ex. high positive funding would suggest a demand for long leverage).
1.“Classic Bull Market” (Highlighted in Figure 1.0)
In a classic bull market, it’s assumed that we’ll see a general uptrend in price, increased OI-marketcap-ratio, and generally high positive funding rates. In these markets, while price is going up, market participants are on aggregate opening more contracts. This suggests that there is high demand for long-sided leverage.
Funding rates remaining highly positive for extended periods of time means people are willing to pay a premium both upon entering a long-sided trade and in ongoing funding rates.
In other words, traders are willing to pay a premium to increase their exposure via leverage. The premium comes from perp price being more expensive than spot in this case, and positive funding rates mean they’ll need to pay to hold their perps position.
2.What might that say?
The “true” demand for perps is as a form of long-sided leverage. In a case like this, the market believes the price of BTC will go up and wants to profit from that as much as possible.
3.What trades are happening in this market?
“Moonboy long”: A trader who can only buy 1 outright BTC instead buys 10 BTC worth of long perps, multiplying their potential gains from a price increase (running the risk that losses from a price decrease are also multiplied).
Basis / Funding trades: Traders enter a short position on perps while simultaneously buying spot BTC. There are two ways a trader profits from this trade. The spot and perp trading price eventually equalise, thus allowing the trader to close both positions simultaneously at an overall profit. While futures remain at a premium to spot, then by definition funding on perps remains positive and instead traders profit from collecting the funding on their short position.
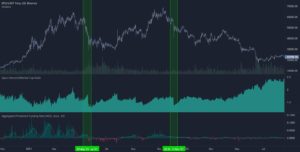
Figure 1.1: The chart above shows BTCUSDT Perp, Open Interest / Market Cap Ratio, and Aggregated Predicted Funding Rate from November 2020 to August 2022. Note the highlighted sections referring to liquidation cascades.
1. The Infamous “Cascading Liquidations.” (Highlighted in Figure 1.1)
Capitulation is a general-forced selling event where deleveraging occurs. As a result, we’ll generally see a sudden drop in price, a decrease in OI-marketcap-ratio, and a rotation where funding rates flip negative.
In a market like this, price drop can happen very suddenly. When the market ratio drops along with price, there’s generally a decrease in demand for perps that occurs where positions are closed down and leverage is rapidly flushed out of the system.
2. What that might say?
Positions being closed are likely forced sell liquidations (given that there is enough sell pressure to keep perp price below spot).
Small drops in price start the forced selling on highly leveraged positions. These liquidations put further sell pressure on the product, pushing price further down, causing more liquidations and thus the term “cascade.” These events act as further evidence that the periods preceding them had market participants positioned leveraged long.
3. What trades are happening in this market?
For those who foresee the drop, short positions take profit.
In the aftermath of such events, the “forced” part of liquidations suggests that the market was made to sell to a price below what it normally would, so those who can enter long at the right time benefit from the rebound as price corrects to “true” current market valuations like a rubber band snapping back into place.
No alt text provided for this image
Figure 1.2: The chart above shows BTCUSDT Perp, Open Interest / Market Cap Ratio, and Aggregated Predicted Funding Rate from November 2020 to August 2022. Note the highlighted section referring to ‘doomsday season.’
III. Doomsday Season (Highlighted in Figure 1.2)
In conditions post May 2021 capitulation, we saw bleak crypto market sentiment characterised by unstable prices, weak price action, and OI-marketcap-ratio increasing slightly faster than the decrease in price explains. On top of all of that, funding remained negative.
- What might that say?
There is strong demand for short exposure.
In some way, this can be seen as a reverse of the classic bull market. It’s not that these conditions are akin to an extended crypto winter, but instead, there is consistent fear that a sudden drop is imminent while prices remain uncertain.
2. What trades are happening in this market?
Those still holding spot are looking for ways to hedge risk.
Some are betting big that a price decrease is imminent, and willing to pay a premium for short positions.
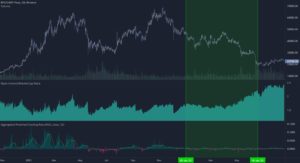
Figure 1.3: The chart above shows BTCUSDT Perp, Open Interest / Market Cap Ratio, and Aggregated Predicted Funding Rate from November 2020 to August 2022. Note the highlighted section referring to a controlled selling environment.
- Extended Crypto Winter (Highlighted in Figure 1.3)
A crypto winter, or extended bear market is marked by a constant downtrend in price action, an inverse relationship between price action and OI-marketcap-ratio, and generally neutral funding rates.
When we see OI-marketcap-ratio inversely related to price, we gather that new contracts are neither opening or closing in meaningful ways. This lack of one-sided perp demand is further illustrated in neutral funding rates.
2. What might that say?
There is net-sell pressure on spot Bitcoin. Rather than there being a high demand for downside speculation (as in doomsday season), markets are simply offloading their holdings.
The fact that dropping price does not incite sudden liquidations suggests that there aren’t many leveraged long positions accumulated.
3. What trades are happening in this market?
Constant and ongoing selling of physical Bitcoin.
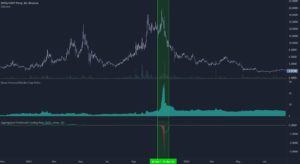
Figure 2.0: The chart above shows OMGUSDT Perp, Open Interest / Market Cap Ratio, and Aggregated Predicted Funding Rate from November 2020 to August 2022. Note the highlighted section referring to extreme demand for position hedging.
V: Extreme Demand For Position Hedging (Highlighted in Figure 2.0)
In certain scenarios, such as fundamentally driven trades or news events like the OMG-BOBA airdrop in 2021 or ETH’s ‘The Merge’ in 2022, a common trade thesis becomes broadly adopted by the market. In cases such as these, traders have high spot demand but low price fluctuation demand, hence, a high demand for hedging. As a result, open interest increases regardless of price action and funding remains extremely negative.
There is usually some fundamental driver for these events (in the case of OMG pictured in Figure 2.0, an imminent airdrop spiked spot demand).
- What might that say?
The perp metrics exhibited from OMG suggested that there was a single opinion being expressed between market participants. The broader market showed that traders valued the promised airdrop but had no interest in the OMG token, hence extreme hedging.
2. What trades are happening in this market?
The general trade was to buy spot OMG to receive the airdrop and sell short perps to hedge price movement of OMG. But the demand for this trade was so strong that spot price was pushed up and perp price was pushed down.
In fact, the market, being its efficient self, pushed the difference in spot and perp to be equal to the value of the airdrop. So those who jumped into the trade at the very end probably ended up roughly breaking even.
So which traders really made it in this airdrop? For spot holders, probably the ones who got in before spot price was driven up who then either profited from the airdrop or from selling into the strong demand. For perp traders, the huge imbalance in price gave the opportunity to collect funding on the long side (by taking the “unwanted” side of the trade) and these positions could have been hedged with traditional “borrow then sell” shorts using margin.
Some other ways one could look at the data and gather (possibly different) insights into the market that we aren’t covering:
- Comparing OI-marketcap-ratio at the same price but different times throughout history; how has perp demand at the same price changed?
- Comparing perp OI and basis to other derivatives like options; how is the market expressing different time-based opinions?
- How does perp trading volume in any given period change; how does it compare to spot volume in those periods?
- The list is endless – what are your favourite metrics to look at?
While certainly not an exhaustive list of market conditions and recognising we took a very focused approach to looking at these data points, hopefully you found this interesting or educational in some way.
Some closing remarks
Just a full disclosure here, none of the scenarios above explore the whole picture and certainly should not be taken as advice on how to make financial decisions. They are simply some fun observations on historical data that hopefully help support an understanding of crypto perpetual futures and their place in the market.
For those who made it through to this point, here’s something to go check out: have a look at current ETH markets (spot, options and perps). What do you observe in how the market is positioning itself and where the demand is? Let us know what you think!
Hint / our observations: remember to consider the bigger picture and topics Think10’s Daily Alpha covers, like The Merge and a possible Proof-of-Work ETHW fork. Also, note long demand for one reason can always counteract short demand for another, keeping funding fairly neutral.
Thanks for having a read, and please feel free to reach out with comments, questions, or your personal observations on the subject!