Market Cycles:
Market cycles can be described as cyclical patterns, trends, and somewhat circular behaviours that occur across different economic and business environments. Like the weather, market cycles occur naturally and cyclically as integral and inherent components of any given marketplace, though different markets are informed by different drivers.For example, the mechanics of a real estate cycle will be very different from the drivers of a crypto market cycle. Case and point, different markets tend to have nuances that are specific to their sector – the crypto markets included. One of the key drivers of a Bitcoin market cycle, is its halving cycle. The supply and demand fundamentals behind Bitcoin, and the inflation that occurs in Bitcoin from its mining, are core components that contribute toward its cycles.As Bitcoin and the broader digital asset class have matured and become more well-established, factors such as derivatives, high futures trading volumes, and the speculative culture surrounding cryptocurrencies have become more entrenched, affecting both cycle length and behaviour.
For those who have closely followed Bitcoin’s historic performance it’s commonly accepted that we are currently in the fourth distinct cycle – all of which have been influenced by ‘the Bitcoin halving,’ supply, network effects, overall adoption, and macroeconomic contexts. Of recent, BTC and the broader crypto asset class has been behaving more like a risk asset correlating with the Nasdaq and broader global financial market performance. BTC’s halving is only one part of the puzzle and knowing context is paramount. We tend not to sail when there’s no wind, and we tend not to ski if the snow hasn’t fallen yet because we’re aware of the conditions. It’s no different for financial or digital assets as BTC does not exist in a vacuum, but rather, is positioned in a complex global financial context.Let’s take a look at the phases that typically characterise a market cycle as applied to the crypto asset class.
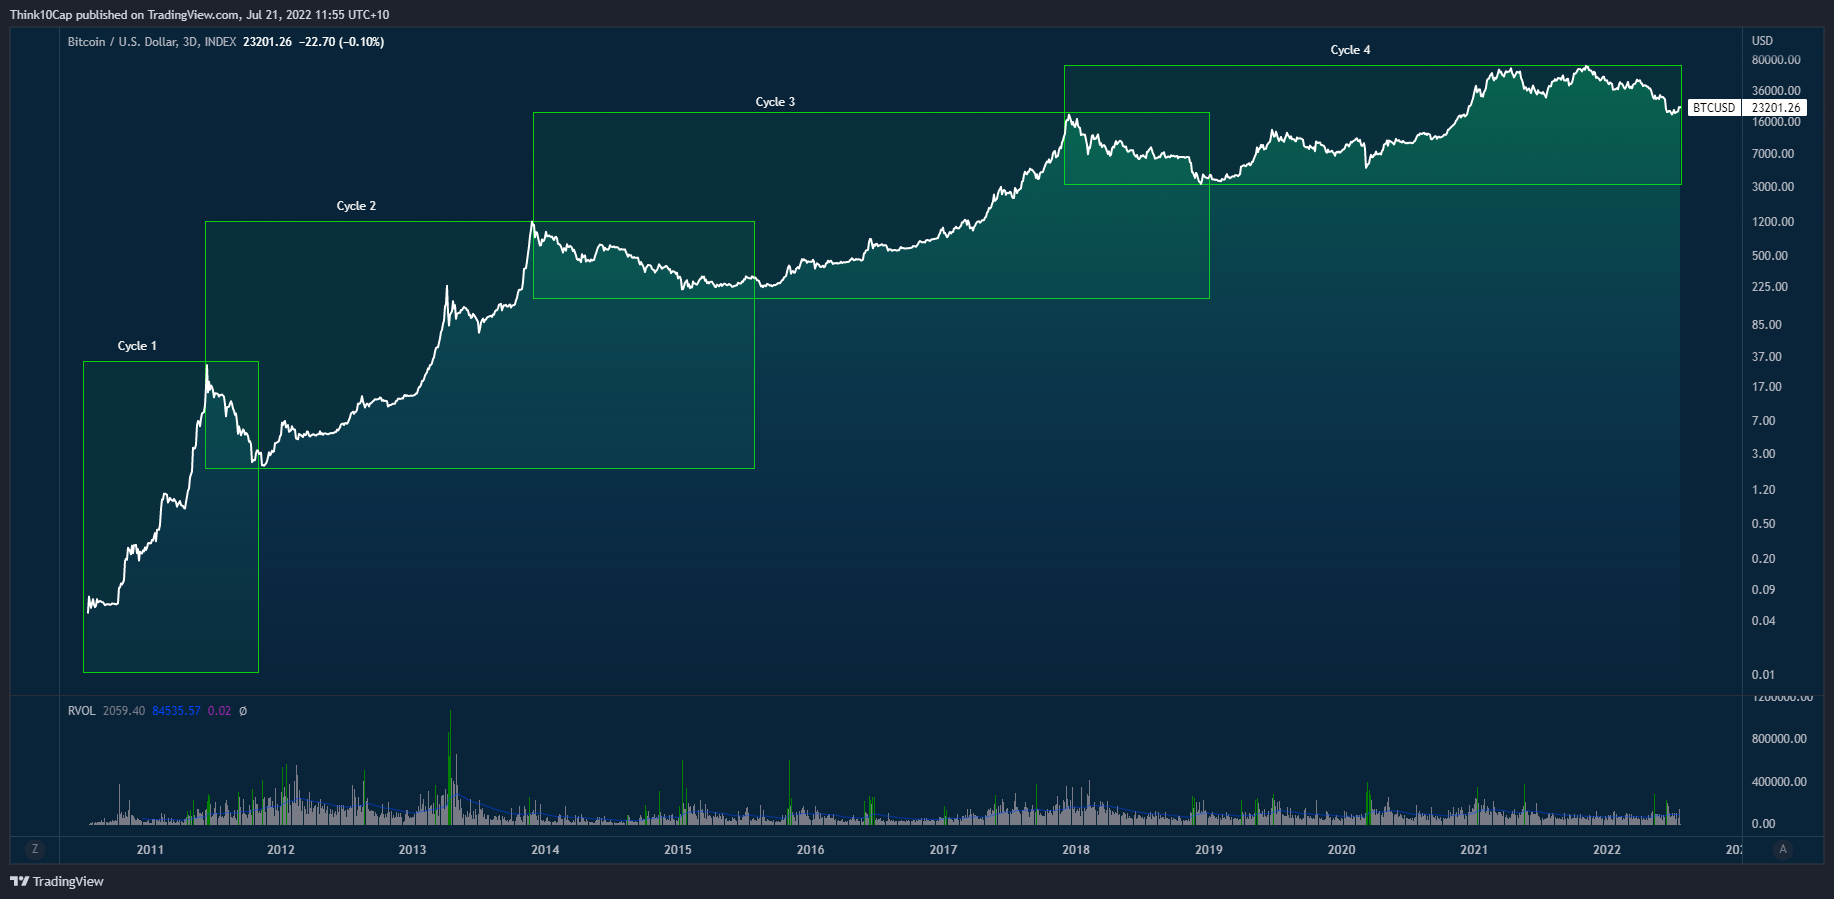
Crypto market cycles have been happening since Bitcoin’s inception in 2009. Bitcoin’s first parabolic run marked a high of nearly $32 USD in 2011 and marked the peak of the first cycle. The second cycle followed from 2011 to 2013 where BTC topped at $1,242, marking the top of the second bull-run. The third cycle topped at $19,800 in 2017 and Bitcoin truly began to generate broad public interest and media attention as the rally coined newly minted millionaires. Lastly, the fourth and current cycle topped just short of $69,000 in November of 2021 where Bitcoin garnered institutional adoption as an asset that is here to stay. It can be said that crypto market cycles are characterised by four phases: accumulation, mark-up, distribution and run-down.
Image 1: This chart illustrates each parabolic run since 2011

Accumulation
The accumulation phase is generally a distinct change marked by the changing of hands from sellers to strong buyers. From market fundamentals to significantly discounted prices, market participants begin to see risk vs. reward to the upside as favourable amongst attractive valuations – often contrary to overall market sentiment being quite pessimistic or bearish. Whether it’s a true market bottom, or ranging price action where accumulation occurs, this phase marks the change in trend where buyers begin to soak up long positions which precede a trend to the up-side.
Mark-up (Bull Market)
The bull market is most often associated with to-the-moon culture, up-only retail, and parabolic price discovery. While it doesn’t always have to be like that, the mark-up phase is typified by the early majority entering the market and prices move higher. Technically, higher highs are made and observable uptrend forms on the charts on longer timeframes. Gradually, the bull market drives clearly up-trending conditions which contrast previous ranges of accumulation or trending markets. While I’m personally not a huge fan of mapping any kind of linear psychological experience, generally a bull market brings to optimism and euphoria.
As a bull run gathers and momentum, it’s destined to discover the market top where participants are inclined to take profits and close their positions down. The end of the run can generally be characterised by the late majority finally choosing to join the market, leading to a large increase in market volume and many cases of excessive leverage and liquidations in the crypto market at least. To the pros, they often call this last majority ‘exit liquidity’ where the late buyers are left holding the bags when the music stops, and blow-off top turns into the next of distribution.
Distribution
In the distribution phase, price discovery cools off and bullish sentiment begins to waver. At first, and hopefully not for too long, late comers will often add to their positions with certainty that this is just a quick pullback. For those late to the party, the notion that the uptrend will remain and promise continued gains can often lead to obliviousness to the fact that this is indeed a distribution event. Top traders close their positions early (or distribute them in other words), and sellers begin to gradually outweigh buyers. This marks the peak of the market top, and a high-volume turnaround is prime for experienced traders to take profits and open short positions into an overvalued market.
Mark Down (Bear Market)
Do Your Research
At Think10, we’re committed to providing forward-thinking entrepreneurs with the support that you need for long-term success throughout all phases of the market. We take an informed and reasonable approach to investment, supporting all stages of start-up growth and always thinking ten steps ahead. If you want to learn more about the nature of crypto markets, contact us today.

